
The following article is based on a presentation by Tiago Pinho, Blip's Head of Product, that took place at the Product Weekend event on February 28th and March 1st, powered by Blip, where key topics on Product Management were discussed, offering valuable insights and reflections on the matter.
Introduction
Experimentation is the key to continuous improvement, innovation, and data-driven decision-making in modern organizations. Yet, many large companies struggle to implement a structured experimentation culture due to resistance to change, misaligned KPIs, and lack of top-management support. By embedding experimentation into their core business processes, organizations can optimize products, improve customer experience, and ultimately drive higher revenue growth. This article explores how experimentation can transform businesses, the challenges it presents, and how to successfully implement a testing mindset.
In large organizations, decision-making is often influenced by internal biases, past experiences, or executive opinions rather than objective data. This leads to inefficiencies, increased costs, and missed opportunities for growth. Many organizations implement changes without validating their impact, leading to unintended negative consequences such as customer churn, reduced engagement, or declining revenues.
By adopting a structured experimentation framework, organizations can minimize risks associated with changes, optimize their offerings through data-backed insights, and uncover new opportunities for innovation. Instead of making assumptions, companies can use real-world evidence to guide their strategic initiatives. This shift not only reduces uncertainty but also fosters a culture of continuous learning and improvement.
Experimentation has been at the core of success for many industry leaders:
- Barack Obama's 2008 election campaign used A/B testing on its splash page, increasing the email sign-up rate by 40.6%, leading to an estimated $60M in additional donations. This demonstrated the power of data-driven decision-making in political campaigns.
- Google’s 41 shades of blue experiment helped them determine the most engaging link color, generating an estimated $200M in additional revenue by optimizing a seemingly minor UI element.
- com runs thousands of A/B tests simultaneously to optimize user experience and increase conversion rates. Their rigorous experimentation culture allows them to continuously improve customer engagement and revenue.
- Amazon’s one-click purchase feature was tested to reduce friction in the checkout process, leading to significant improvements in conversion rates and reduced cart abandonment.
These examples highlight how structured experimentation can have a direct and measurable impact on business outcomes, reinforcing the importance of a data-driven culture.

The Betfair journey
Betfair is one of the Flutter International brands and operates worlwide across more than 50 countries. Back in 2019, Betfair products were facing many challenges mainly related with the dated underlying technology which has led the decision to invest in rewriting all Betfair products from the scratch in a different language (React Native). As part of this massive project, a new CMS was built and configured, based on principles of content reusability and scalability. Why? Given that Betfair operates worldwide with the vision of becoming the number one brand in key markets, a "one size fits all" approach is simply not an option. Each market comes with its own unique regulatory landscape, customer behavior and sports cultural nuances. Our product has been designed with flexibility at its core, allowing it to be adapted and optimized for local needs. This is where experimentation becomes invaluable. In the end, near to 90% of our products content and functionality could be managed through configuration, without any dependency of tech squads intervention which provided great flexibility for finding the optimal content setup. Naturally, such great flexibility led to the question: What if we integrate the CMS with an experimentation engine, enabling an endless number of content combinations that could be tested against each other to see which performs better?
Challenges
When we set out to implement an experimentation mindset in our organization, we knew we were aiming for something bold and transformative.
The biggest hurdle wasn’t technical—it was the mindset. The project we were working on operated under a feature factory model, where the priority was to ship new features as quickly as possible rather than validating their impact. Short-term gains were prioritized over long-term learning, and teams were more focused on delivery milestones than on measuring real business outcomes. Additionally, resistance to change was evident. Some stakeholders were skeptical, questioning whether experimentation was worth the effort or if it would just slow things down.
But we didn’t settle. Using spare capacity from a few sprints, we built a proof of concept (POC) to demonstrate the value of experimentation. Once we had results, we organized demos to showcase what was possible, highlighting the power of the tool that we have just created and could be further improved. These early wins helped shift some perspectives, but the real turning point came with a leadership change.
This experience reinforced a crucial lesson: cultural change takes time, persistence, and proof.

The implementation
Going from experimenting on nothing to experimenting on everything came with its own challenges. Suddenly, experimentation wasn’t the bottleneck—scaling it efficiently was.
Competing Experiments and Resource Conflicts
One of the first issues we faced was competing experiments. We wanted to test different initiatives at the same time, but without a clear prioritization system, we ran into resource conflicts, and we didn’t have a way of avoiding results contamination due to overlapping tests. This led to a difficult prioritization of experiments to be run sequentially, which significantly increased the time of market of the features being tested.
Lack of Structured Communication and Knowledge Sharing
Another major gap was the lack of a structured communication plan for experiment results. Teams were running tests, but insights weren’t being shared effectively across the organization. This led to duplication of efforts—different teams unknowingly experimenting on similar things or failing to build on past learnings. It became clear that we needed a repository of experiment results and a process to synthesize insights across teams.
Upskilling and Ensuring Stakeholder Understanding
We also faced an upskilling challenge. While enthusiasm for experimentation was high, many stakeholders—from product managers/owners to engineers —didn’t fully understand best practices, statistical significance, or how to properly interpret test results. We had to invest in training to ensure all involved parties fully understood the role they had to play in each part of the experimentation process.
Technical Debt and Post-Experiment Cleanup
On the technical side, tech debt became a real liability. Experimentation requires rapid iteration, but when an experiment is completed, there’s additional work to be done either to gold plate it with quality standards (in case of successful variants) or to remove the variants code. We had to enforce a structured post-experiment cleanup process to prevent long-term issues like cluttered code blocks causing performance concerns.
Increased Time to Market Due to Experimentation
Another unintended consequence was the increased time to market. Running experiments takes time—defining hypotheses, setting up tests, collecting data, and analyzing results. While the long-term benefit was clear, stakeholders were frustrated with the perceived slowdown in feature delivery. This required aligning expectations and refining our process to strike the right balance between speed and data-driven decision-making.
Cross-Discipline Collaboration and Alignment
Lastly, cross-discipline articulation became a challenge. Experimentation requires close collaboration between product, engineering, analytics, content operations, marketing, and customer support. Without proper alignment, misunderstandings arose about test designs, success metrics, or operational impact. We had to create cross-functional experimentation rituals—regular syncs, shared documentation, and clearer ownership structures—to ensure that every test was executed smoothly.

The Experimentation process
Our experimentation process contains the following steps:
- Identify Areas for Testing
- Segmentation
- Hypothesis Formulation
- Prioritization
- Build and Run
- Result Analysis and Iterate
1. Identify Areas for Testing
One of the most valuable sources for experimentation ideas is the voice of the customer. While ideas can come from various places—competitor analysis, industry trends, internal brainstorming—nothing compares to direct insights from those who interact with our product daily. To harness this, we’ve built a robust system to monitor customer touchpoints across multiple channels, including CRM surveys, app store reviews, user testing, in-app feedback, Google Analytics, internal feedback, social media, and customer service operations. Compiling insights from diverse sources proved to be a challenge, as data was collected in multiple formats—emails, spreadsheets, powerpoints, dashboards, … To address this, we assigned a Product Manager/User Researcher to each VOC touchpoint so they centralize and standardize the data, transforming it into a unified language that could be systematically analyzed, compared, and prioritized in our experimentation backlog.
2. Segmentation
After identifying what to test, the next crucial step is determining who to test it with. Our business spans multiple jurisdictions, meaning our customer base is incredibly diverse, differing in demographics, culture, purchasing power, betting knowledge, and behaviors. Additionally, operating in highly regulated markets adds another layer of complexity, as local legislation requires us to adapt our product offerings accordingly. This makes jurisdiction the first and most fundamental level of segmentation. Beyond geography, it’s essential to define which customer profiles we want to target. Should an experiment be applied to all users, or only specific segments? Are we testing with high-value or low-value customers? Are we looking at new users, experienced bettors, or casual players? Do we need to differentiate by age groups, device type (iOS vs. Android), or engagement level? Effective segmentation ensures that experiments yield relevant, actionable insights while maximizing impact and compliance across diverse user groups.
3. Hypothesis Formulation
To ensure our experiments are structured and measurable, we follow a simple yet effective hypothesis framework:
- Theory: We believe that <CHANGE>
- Validation: For <TARGET> will achieve <BENEFIT>
- Objective: We'll be successful when we observe an increase in <PRIMARY METRIC>, without negatively impacting <GUARDRAIL METRIC>.
Primary metrics represent the main goal of the experiment, directly tied to the business outcome we aim to optimize. Guardrail metrics, on the other hand, act as safety checks to ensure there are no unintended negative consequences.
For example, if we hypothesize that reducing the number of mandatory fields in the registration form will improve conversion rates:
- Primary metric: Conversion rate – the percentage of users who complete registration after starting.
- Guardrail metric: Customer support contacts related to registration issues – ensuring that while more users complete the form, they don’t face confusion or errors that could lead to an increase in support tickets.
4. Prioritization
When (and When Not) to Experiment
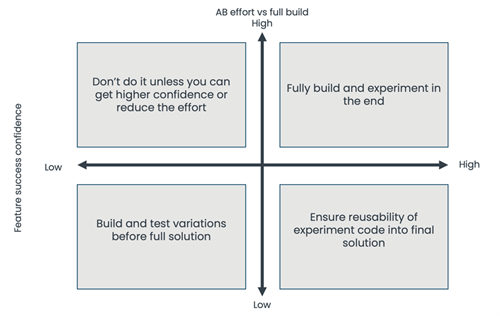
To help prioritize experiments and avoid the "everything must be tested" mentality, we developed an internal framework that has proven to be effective. This framework evaluates potential experiments from two key perspectives: the confidence level in their success and the effort required to run the experiment compared to fully building the solution. Based on these factors, here’s how we approach prioritization:
Low Confidence + High Experimentation Cost
This is the worst-case scenario. It’s risky and expensive.
Recommendation:
Don’t proceed — unless you can either:
- Increase confidence (e.g., gather more insights, user feedback, or prototype results)
- Reduce effort (e.g., simplify the experiment setup with engineering)
Low Confidence + Low Experimentation Cost
These are great candidates for testing. The stakes are low, and even a failed test can yield valuable learnings.
Recommendation:
Proceed with the experiment. Use it as a discovery tool with minimal risk and potential high upside.
High Confidence + Low Experimentation Cost
If you're confident the change will have a positive impact, testing is still useful—especially to measure the actual uplift.
Recommendation:
Run the experiment.
- Make the code reusable, since it’s likely to be fully implemented later.
- Use the test to confirm assumptions and fine-tune before full rollout.
High Confidence + High Experimentation Cost
At this point, experimentation may not be worth the overhead. If the cost to test is similar to full implementation, testing adds unnecessary friction.
Recommendation:
Skip the experiment.
- Instead, phase-rollout the full solution.
- Gradually introduce it to users while monitoring impact and guardrails.
- This allows validation without delaying value delivery.
By following this framework, we ensure that experimentation remains focused, efficient, and strategically aligned—maximizing value while avoiding waste.
5. Build and run
To build and run effective experiments, we must consider three key aspects: randomness of the population, traffic volume, and experiment duration.
a) Randomness of the Population
Ensuring a random allocation of users is crucial to eliminate bias and produce reliable results. When using a third-party experimentation platform, this process is typically handled automatically. However, when implementing an internal solution, it is essential to ensure that traffic is split truly at random. One way to verify this randomness is through an A/A test, where all test groups are shown the same variant. If the groups are truly random, their primary metric performance should be statistically identical. Any significant differences may indicate an issue with traffic allocation that needs to be addressed before running A/B tests.
b) Traffic Volume
The number of users included in an experiment directly impacts the statistical confidence of the results. To illustrate this, imagine flipping a coin. If you flip it only three times and get three heads, you can’t confidently conclude that the coin is biased. Even after ten flips, a 6/4 split might still be due to chance. So, how many flips—or in our case, how much traffic—do we need to reach a reliable conclusion?
The required traffic volume is determined by the following formula:

Where:
- n = required sample size (traffic volume per variation)
- p = baseline conversion rate (current performance of the primary metric)
- d = minimum detectable effect (expected improvement in the primary metric)
- Z = Z-score corresponding to the desired statistical significance level (e.g., 1.96 for 95% confidence)
This formula helps ensure that experiments have enough data to reach a statistically significant conclusion while avoiding underpowered tests that yield inconclusive results.
c) Experiment Duration
The duration of an experiment is directly tied to the daily traffic volume of the product. Simply put, the more daily traffic we have, the faster we can reach statistical significance. The duration can be calculated using the formula:

6. Result Analysis and Iterate
Aspects to Consider When Analyzing Results
Once an experiment has run its course, analyzing the results correctly and thoroughly is just as important as designing the test itself. A common pitfall is focusing solely on whether one variation "won" without digging deeper into why the results turned out the way they did. To extract meaningful and actionable insights, several key factors must be considered.
a) Statistical Significance and Minimum Detectable Effect (MDE)
The first and most obvious question is: Did the primary metric change in a statistically significant way? A minor fluctuation in conversion rate might not mean much if it falls within the margin of error, so checking for statistical significance ensures that any observed impact is likely due to the change itself and not random chance. Additionally, it’s important to verify whether the minimum detectable effect (MDE) was reached—if the test was underpowered, a potential uplift might have gone unnoticed simply because there wasn’t enough traffic or time to capture it.
b) Guardrail Metrics
Beyond the primary metric, guardrail metrics must be closely monitored. A test that improves conversion but increases churn, customer complaints, or operational costs might not be worth implementing. If any guardrail metrics show red flags, it’s a strong indicator that the change, despite its positive impact in one area, might have unintended negative consequences elsewhere.
c) Segment Consistency
Another critical aspect is segment consistency. Results should be analyzed across different traffic sources, device types, jurisdictions, and customer profiles (e.g., new vs. returning users, high-value vs. low-value customers). If an experiment shows a strong uplift overall but performs poorly for a particular segment, a one-size-fits-all rollout may not be the best approach. Identifying these differences can help refine targeting strategies and even inspire follow-up experiments tailored to specific user groups.
d) Accounting for External Factors
Finally, external factors must always be accounted for. Seasonality, major sales events, holidays, and external market changes can all skew results, making it seem like an experiment had a larger or smaller impact than it actually did. For example, a betting platform might see increased engagement during the World Cup, or an e-commerce store could experience natural conversion spikes on Black Friday—factors that must be separated from the experiment’s true effect.
By considering these factors, we ensure that the insights drawn from our experiments are not only accurate but also relevant and applicable to real-world decision-making.
e) Next Steps After the Experiment
Once an experiment concludes, the work isn’t over—whether it was a success or not, next steps must be carefully considered to ensure that insights are properly applied, and the product remains clean and efficient.
If the Experiment Was Successful:
- Gold-plating the Solution: If an experiment was successful, the next priority is to gold-plate the solution—meaning it should be refined, optimized, and implemented with high-quality standards. In many cases, experiments are designed for speed rather than perfection, which can lead to certain shortcuts in best practices, such as hardcoded elements, inefficient logic, or missing scalability considerations. Before rolling out the winning variant at full scale, it’s crucial to ensure that the final implementation meets production-level standards, follows proper coding practices, and integrates seamlessly with existing systems. This step helps future-proof the solution and prevents technical debt from accumulating.
If the Experiment Was Not Successful:
On the other hand, if an experiment did not yield positive results, it’s essential to understand why before simply discarding the idea. There are several possible reasons:
- Was the hypothesis incorrect? Perhaps the expected user behavior shift didn’t happen as predicted.
- Were the test variations flawed? Bugs or UX friction could have negatively impacted the outcome.
- Did external factors influence results? Market conditions, seasonality, or unforeseen trends might have played a role.
Regardless of the reason, any unused or experimental code should be cleaned up to prevent dead code from accumulating.
f) Sharing Results Across the Organization
Finally, sharing results across the organization is a critical but often overlooked step. Experimentation is not just about individual tests—it’s about building a culture of learning. By documenting and communicating findings—whether positive or negative—teams can avoid duplicating efforts, identify patterns across different tests, and apply learnings to future initiatives. A centralized repository of experiment insights can be invaluable in shaping strategic decisions and refining testing approaches over time.
In short, experimentation doesn’t end when results are in—it ends when insights are applied, technical debt is managed, and the organization learns from every test.

Conclusion: The Power of Continuous Experimentation
Embracing a continuous experimentation mindset enables companies to make better decisions, innovate faster, and stay ahead of competitors. Organizations that prioritize testing gain deeper customer insights, mitigate risks, and optimize their product offerings with real-world data.
However, this shift requires strong top management support and a break from the feature factory mindset. Experimentation thrives when guided by customer insights, making the Voice of the Customer a key source of hypotheses. Systematically monitoring customer touchpoints ensures that testing efforts are aligned with real user needs.
For reliable results, experiments must be based on strong hypotheses with clear primary and guardrail metrics. Ensuring random testing groups, sufficient traffic volume, and proper duration is critical to avoiding biased or misleading conclusions.
Finally, all results matter—even those that don’t show improvements. Negative or neutral outcomes still provide valuable learnings, helping refine future tests. By fostering a culture of continuous learning and data-driven decision-making, companies set themselves up for long-term success.

Tiago Pinho, Soraia Gonçalves


